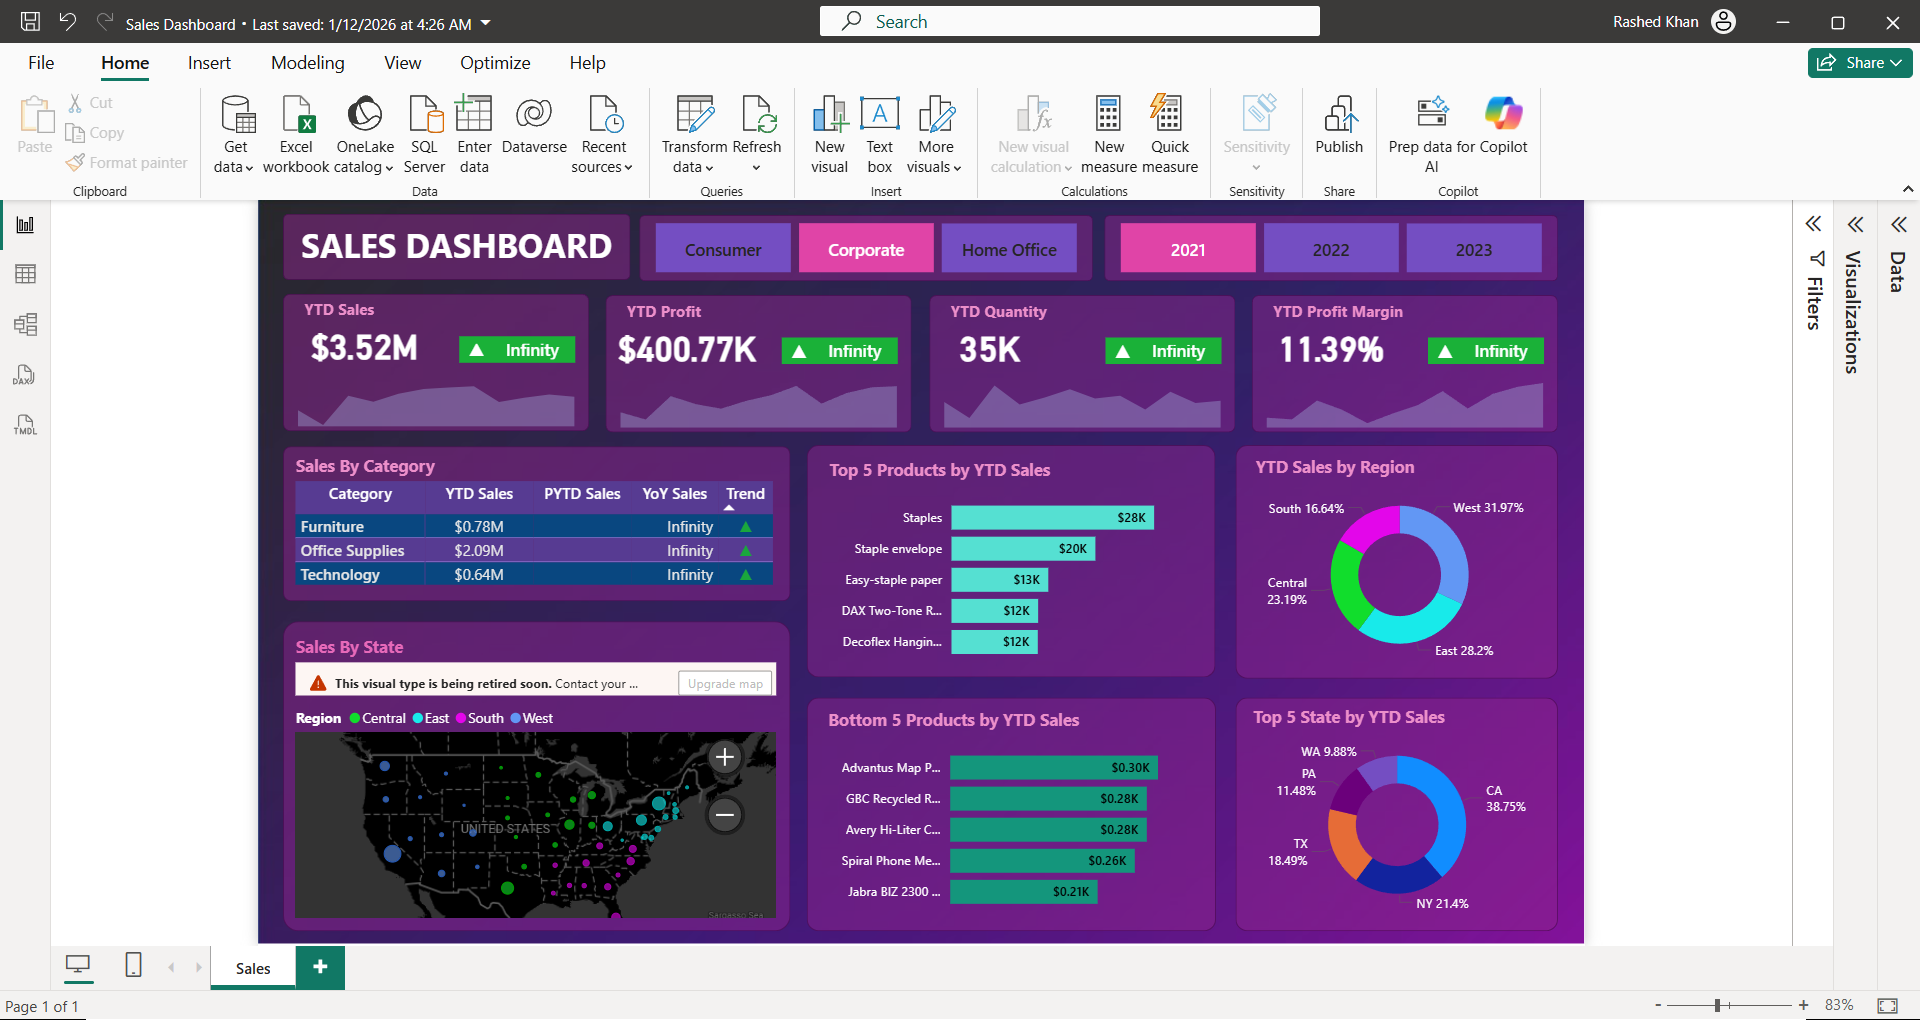

This Power BI dashboard was built to analyze a large-scale US e-commerce dataset of 113,270 orders across 49 states.
Key features of this dashboard:
– Sales performance tracking across 4 US regions (East, West, South, Central)
– Customer segment analysis (Consumer, Corporate, Home Office)
– Product category breakdown (Technology, Furniture, Office Supplies)
– Delivery status monitoring (On Time, Late, Cancelled, Advance)
– 1,849 products tracked with profitability per order
– US state-level map visualization using geospatial coordinates
– 42,000+ unique customers analyzed
Total dataset: $23.1M in sales | $2.6M profit | 49 states